Tag Archives: datacenter networks

Paper Notes on “CORFU: A distributed shared log” [TOCS’13]

Last Monday we looked at Tango, a system for replicating a data structure to provide linearizable semantics and fault-tolerance. Tango is built up on CORFU, a replicated log, built over storage nodes. This paper notes article covers “CORFU: A distributed shared log” also by Balakrishnan et al. from TOCS December 2013. I believe that this paper elaborates on “CORFU: A Shared Log Design for Flash Clusters” by Balakrishnan et al from NSDI 2012 and that the NSDI paper is not a prerequisite for the TOCS paper.

What we already know?

From the Tango paper, we learned that CORFU provides a replicated log with support for the following operations: append, check, read, trim and fill.

Its main two components are: a sequencer, which hands out addresses in the log and storage nodes (such as SSDs) which store log entries. Storage nodes are divided into clusters and a variant of chain replication is used between them. Each cluster is responsible for a subset of log addresses.

Summary

This paper presents CORFU, a shared log, distributed over storage nodes. It main advantage over existing systems is its scalability as its not bottlenecked by the I/O of a single host.

Local addresses -> physical addresses

Each storage node exposes a infinite write-once logical address space with read, write, delete and fill operations for each address. Delete is used when the data at a particular logical address is not longer required, its physical address can be reused but its logical address cannot. Fill is used to mark that a logical address will not be used in the future. These are implemented using a hash table with various optimizations. A seal operations is also provided which locks a storage node to operates with equal or higher epoch number.

Global addresses -> local addresses

Each client resolves a global address into a set of nodes and a local address in two stages. Firstly, the client uses a local copy of a mapping from ranges in the global addresses space to disjoint subsets of hosts. For example, addresses 0-100K map to replica sets A-C and addresses 100K-200K map to replica sets D-F. A deterministic function (like mod and div) maps the specific global address to a local address a specific replica set like A or C.

Replication

Replica are written to using client-driven chain replication, this means the client writes to each replica in a deterministic order and waits for successful acknowledgment for each storage node before continuing. As a result, write latency scales linearly with the number of replicas. In contrast, majority-based protocol like Raft, Paxos and VRR can replicate a write in as little as 1 RTT, regardless of the number of nodes, in the right conditions. The downside of such protocols is that to tolerant f failure we need 2f+1 nodes instead of f+1.

If a client fails to complete this process then it may be filled in by the next client. Like Raft, this means that clients may be given false negatives, and thus the application utilizing the log must be able to handle this. For example, Raft uses operation id’s and caches to prevent multiple application of the same operation to a state machine in SMR.

A more important failure case is where a client fails to see a committed write since the replica it is querying was removed from the replica set due to network partition/failure and the client is not aware of this change. This is address by issuing leases to the storage units from the sequencer.

Changing projections

Corfu’s sequencer is in some ways analogous to the coordinator/master in tradition protocols. Likewise, Corfu’s changing projection has many parallels with VRR’s view changes or Raft’s term changes. In all cases, a monotonically increasing value (known as the epoch number/view number/term) separates different perspectives on system configuration. Example prospectives include a period of leadership in Raft or a set of projections in CORFU. Each node stores its prospective of this value and each message between nodes includes it. Projection change is initiated by a client, then agreed by storage nodes using a Paxos-like consensus protocol and then each (involved) storage node is sealed in the process. Clients learn of the projection change when they contact storage nodes (since it includes their outdated epoch) and they retrieve the new projection information from a networked storage drive.

My interpretation of changing projections is that each projection change can include a completely new configuration. This mechanism provides us with dynamic membership, in addition to a mechanism for dealing with network failures and partitions.

Evaluation

The authors’ experimental evaluation seems very promising. In some ways, it is difficult for me to determine which gains are from the hardware and which are from CORFU’s design. All of the experiments use two replicas per cluster, thus just two failures are capability of bringing the system down. The use of client-driven chain replication means that I would really like to see how the system scales (particularly its latency) with more replicas.

Conclusions

Corfu is a very interesting system and seems to be a novel point on the solution space of distributed log solutions. Next time, we will take a look at the open source implementation, CorfuDB.
Azure Latency Pilot Study: Part 4 – Variation in results with time

So far in this study, we have only considered the aggregated measurements and how they vary depending on the VMs used. In this post, we will considered how the RTT measurements may have changed over time.

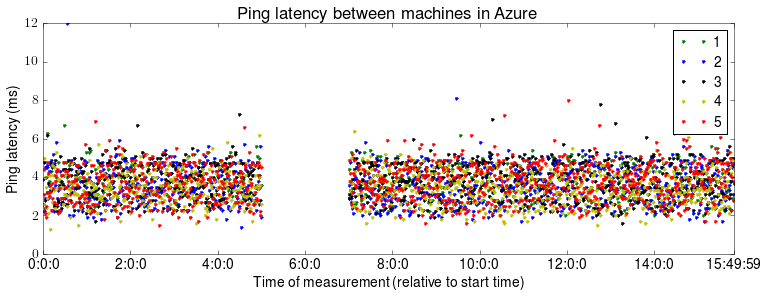
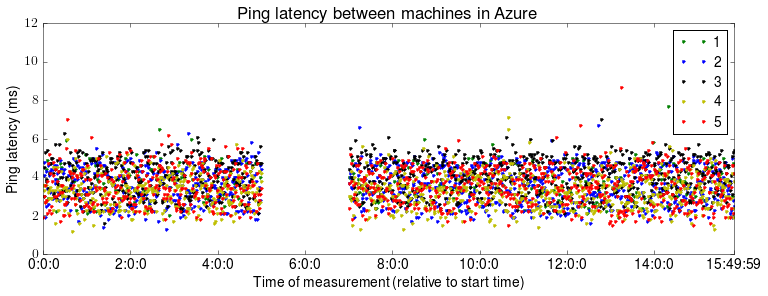
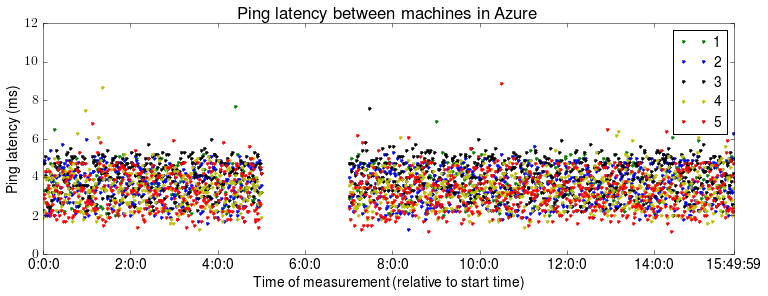
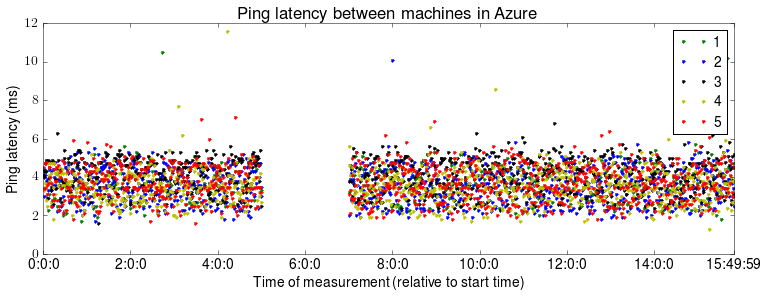
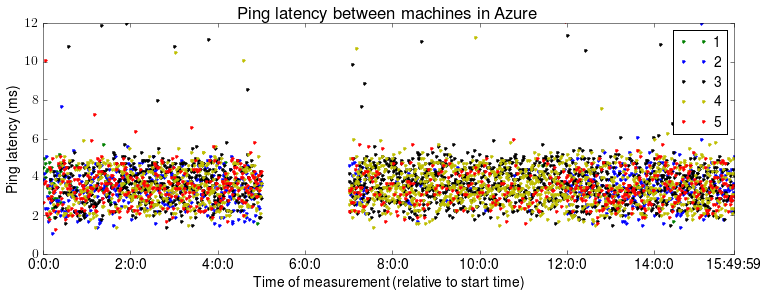
The following 5 plots show the RTT as observed by each machine over time. The y axis stops as 12 ms to aid visibility of the majority of results. Using the CDF of all results from the second part in this series, we can see that these figures thus include around 85% of all data points.

alt text
alt text
alt text
alt text
alt text

The most striking aspect of these figures is the 2 hour gap in the results. The source of this failure is still unknown. Azure reported no machine or network failures during this time and the system removed and continued to take measurements without any manual intervention. Otherwise, between 2 and 5 ms the RTT measurements appear to be fairly randomly distributed, although as we saw last time their distribution approximates normal (as we would expect).

Overall, I am not particularly happy with the results collected so far and hope the next round of tests will generate better results. Tomorrow, we will compare how these results differ from other studies.

Azure Latency Pilot Study: Part 2 – Aggregated results

This is post we will be looking at the results for the Azure latency Pilot study described last week. We will starting by looking at the aggregate results, disregarding the time a measurement was taken and which machines the measurement was taken between.

The 22332 data points have been processed in Python3, in particular using the matplotlib and numpy libraries. The scripts are available in azure-measurements repository.
They currently only use the average round trip time, as reported by hping3, average over 10 pings.

property RTT (ms)
min 1.1
max 1242.2
mean 15.9
std 66.5

The results in the table above are much larger than I expected. Given the large standard deviation and very large maximum value, it is likely that a few large measures have skewed the results. Let’s take a look at the cumulative distribution function (CDF) and percentile points to see if this is the case.

percentile RTT (ms)
25th 3.0
50th 3.8
75th 4.7
90th 61.4
95th 69.7
99th 87.3

alt text

As expect, some large measurements have skewed the results. However, the proportion of measurement which are considered large is much greater then I expected. This warrants further investigation.

Before that, lets take a closer look at how the majority of value are distributed. Due to the central limit theorem and the sufficiently large sample size, we would expect to see a normal distribution. In simulators such as Raft Refloated, we simulate latency as normally distributed with given parameters, discarding values below a threshold value. We can take a closer look at the probability density function (PDF) and see if this is a reasonable approximation.

alt text

The green bars represent the probability of each RTT. We see an approximate normal distribution, although it is clear that this distribution doesn’t have the same parameters as the data set as a whole. The red lines shows a normal distributed with mean 3.6 and standard deviation of 1. This red line appears to be a reasonable approximation and could be used in simulation.

Next post, we will looks at how the measured RTT differs depending which of the 5 machines the measurement was taken between.

Azure Latency Pilot Study: Part 1 – Experimental Setup

This post, the first in a short series, discusses a simple overnight pilot study of measuring network characteristics on Microsoft Azure. This study was to be the first of many. Its purpose was to test the tools and gave some initial measurements, thus informing the the design of more substantial measurement studies in the future.

Motivation

Ultimately, I would like to answer the following questions about today’s cloud offerings:
1. How often do VMs fail in practice? What is the typical downtime? And to what extent are these failures correlated with each other? How does the failure rate vary with different price tiers and different cloud providers? For example, comparing normal instances to low cost instances like Amazon EC2 Spot instances or Google Clouds Preemptible Instances
2. How often do network partitions occur? What types of partitions do we see in practice? Do they isolate individual nodes or divide a cluster into a few disconnected groups? Do partial partitions, which we believe can cause issues for protocols such as Raft, occur in practice?
3. What are the latency characters between VMs? How about between between different datacenters by the same provider or by different providers?
4. How do today’s open source fault-tolerant data stores such as LogCabin or CorfuDB perform in practice? Is this sufficient to meet application demands? How quickly can such system heal after failures?
5. How can use the above to configure systems such as Raft Refloated or Coracle to simulate real work deployments of fault tolerance applications?

Experimental Setup

The experiment was run across virtual machines in the Azure. Azure is Microsoft’s cloud offering and a competitor to services such as Google Cloud and Amazon EC2. Azure was chosen simple over the competition simply because we have access to free credits. This was the first time I had used it (except from hosting the Coracle SIGCOMM demo) and it was relatively straight forward to perform simple operations, though not without its difficulties. For the management of the virtual machines, I mostly used Azure ASM CLI, a command line utility for managing VMs, its written in JS and is open source. This first test used 5 ‘small’ machines in North Europe, running overnight.

The machine themselves where simple Ubuntu 14.03 instance (and yes, Azure does have linux VM’s too). One machine was manually set-up, captured and cloned. Setup involved adding the public key of the data collection server, cloning measurement scripts and running them as a service, installing a few dependencies and running sudo waagent -deprovision before capturing the VM image.

Measurements

The measurement script simply TCP pings (sends SYN and waits for response) all the other machines in the test set every 20 sec and writes the results with test time to disk. It is worth noting that Azure drops ICMP traffic and whilst they acknowledge that is case of external traffic, many people (myself included) could not get internal ICMP traffic through either. The tool used was hping3, and it reported min, max and average round trip from a 10 successive pings.

The measurement server waited until after the end of the measurement study to collect data, to avoid interfering with the measurement. The collection script simply pulls the data from the measurement servers using scp (and the asymmetric keys established earlier). The other management jobs such as cleaning the data files or updating measurement scripts was done using parallel ssh.

Results

The experiment was ran between 19:00 and 08:50:00, across 5 virtual machines. In total, 22332 measurements were involved in the analysis, ranging from 1.1 ms to 1242 ms. The raw data is available online, as are all the scripts used.

Tomorrow, we will look at some analysis of these results.

Paper Notes: The Network is Reliable [ACMQ July’14]

The Network is Reliable is an excellent article which attempts to formalise the discussion on real world failures for distributed systems. There is currently great debate on whether the assumption that network partitions are rare is too strong or too weak, for modern networks. Much of the data which we could use to answer this question is not published, instead is takes the form of anecdotes shared between sysadmins over a beer. This article lets the reader sit at the table and share the stories.

It is worth noting that network partition is used here in the broadest possible sense. We are looking at end-to-end communications and anything which can hinder these. This goes beyond simple link and switch failures to distributed GC, bugs in the NIC, and slow IO.

Here 5 examples of the anecdotes covered:

  • split brain caused by non-transitive reachability on EC2
  • redundancy doesn’t always prevent link failure
  • asymmetric reachability due to bugs in the NIC
  • GC and blocking for  I/O can cause huge runtime latencies
  • short transient failures become long term problem with existing algorithms

So, what does this mean for Unanimous and my research on reliable consensus for real world networks?

My original inspiration for working on consensus algorithms was the need for reliable consensus at the internet edge. With consensus comes fault tolerance,  from this we can construct new systems for preserving privacy and handling personal data, offering users a viable alternative to 3rd party centralised services.

However, it has become apparent that the issues of reliable consensus is much more general. This article illustrates that even within the constrained setting of a datacenter, distributed systems are failing to tolerance the wide range of possible failures.