This post, the first in a short series, discusses a simple overnight pilot study of measuring network characteristics on Microsoft Azure. This study was to be the first of many. Its purpose was to test the tools and gave some initial measurements, thus informing the the design of more substantial measurement studies in the future.
Motivation
Ultimately, I would like to answer the following questions about today’s cloud offerings:
1. How often do VMs fail in practice? What is the typical downtime? And to what extent are these failures correlated with each other? How does the failure rate vary with different price tiers and different cloud providers? For example, comparing normal instances to low cost instances like Amazon EC2 Spot instances or Google Clouds Preemptible Instances
2. How often do network partitions occur? What types of partitions do we see in practice? Do they isolate individual nodes or divide a cluster into a few disconnected groups? Do partial partitions, which we believe can cause issues for protocols such as Raft, occur in practice?
3. What are the latency characters between VMs? How about between between different datacenters by the same provider or by different providers?
4. How do today’s open source fault-tolerant data stores such as LogCabin or CorfuDB perform in practice? Is this sufficient to meet application demands? How quickly can such system heal after failures?
5. How can use the above to configure systems such as Raft Refloated or Coracle to simulate real work deployments of fault tolerance applications?
Experimental Setup
The experiment was run across virtual machines in the Azure. Azure is Microsoft’s cloud offering and a competitor to services such as Google Cloud and Amazon EC2. Azure was chosen simple over the competition simply because we have access to free credits. This was the first time I had used it (except from hosting the Coracle SIGCOMM demo) and it was relatively straight forward to perform simple operations, though not without its difficulties. For the management of the virtual machines, I mostly used Azure ASM CLI, a command line utility for managing VMs, its written in JS and is open source. This first test used 5 ‘small’ machines in North Europe, running overnight.
The machine themselves where simple Ubuntu 14.03 instance (and yes, Azure does have linux VM’s too). One machine was manually set-up, captured and cloned. Setup involved adding the public key of the data collection server, cloning measurement scripts and running them as a service, installing a few dependencies and running sudo waagent -deprovision before capturing the VM image.
Measurements
The measurement script simply TCP pings (sends SYN and waits for response) all the other machines in the test set every 20 sec and writes the results with test time to disk. It is worth noting that Azure drops ICMP traffic and whilst they acknowledge that is case of external traffic, many people (myself included) could not get internal ICMP traffic through either. The tool used was hping3, and it reported min, max and average round trip from a 10 successive pings.
The measurement server waited until after the end of the measurement study to collect data, to avoid interfering with the measurement. The collection script simply pulls the data from the measurement servers using scp (and the asymmetric keys established earlier). The other management jobs such as cleaning the data files or updating measurement scripts was done using parallel ssh.
Results
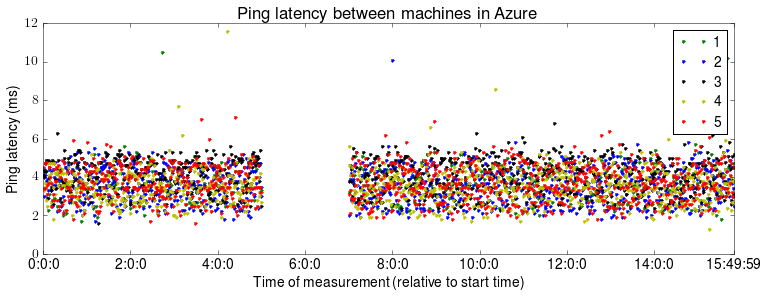
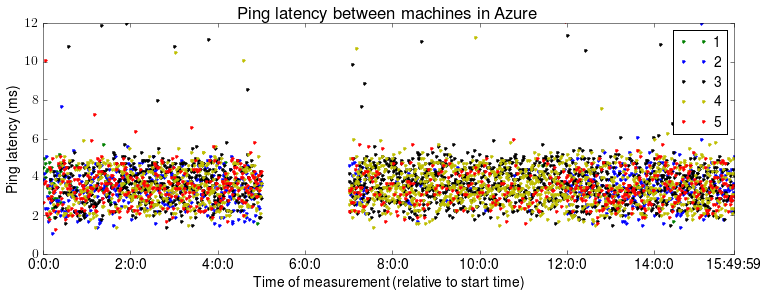
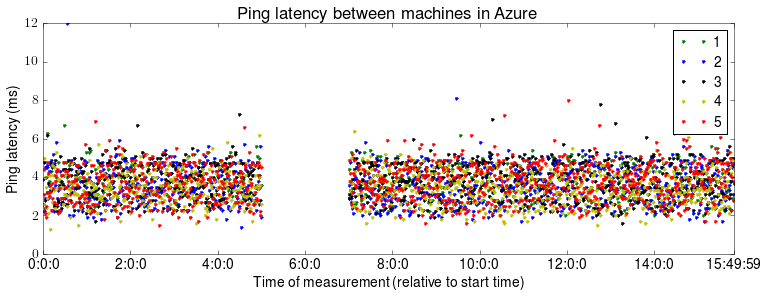
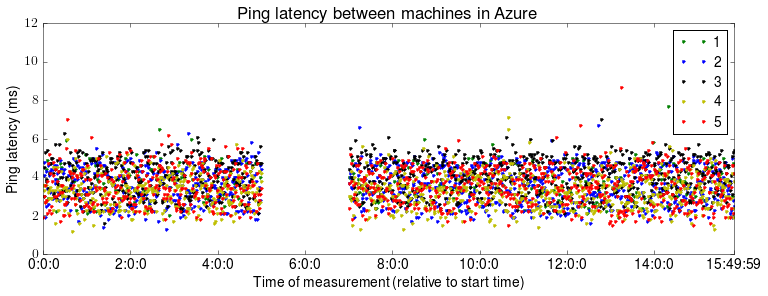
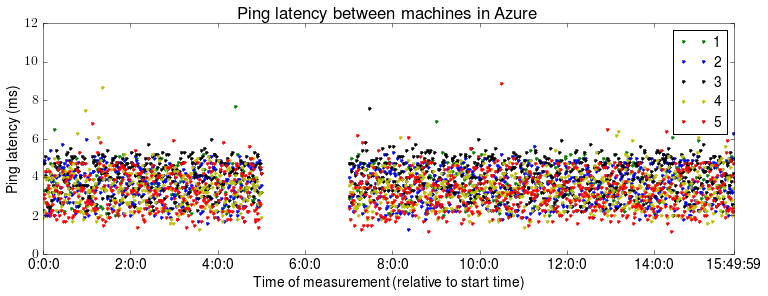
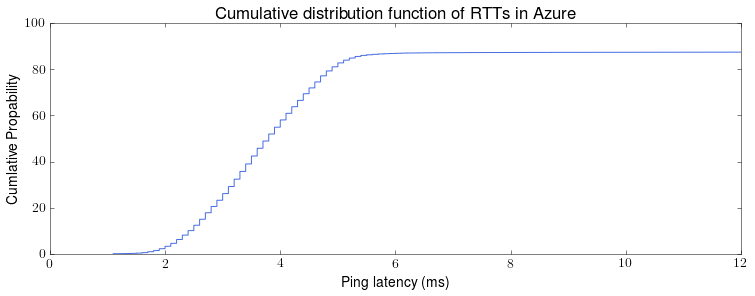
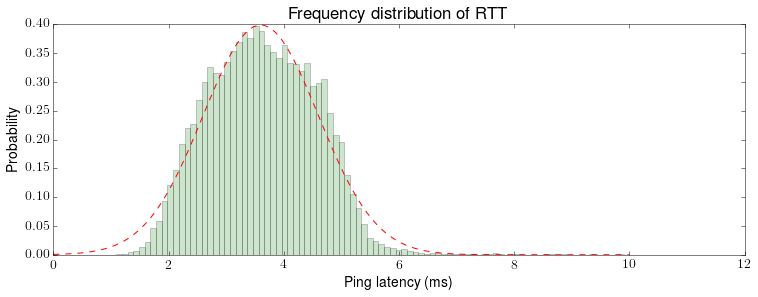
The experiment was ran between 19:00 and 08:50:00, across 5 virtual machines. In total, 22332 measurements were involved in the analysis, ranging from 1.1 ms to 1242 ms. The raw data is available online, as are all the scripts used.
Tomorrow, we will look at some analysis of these results.
